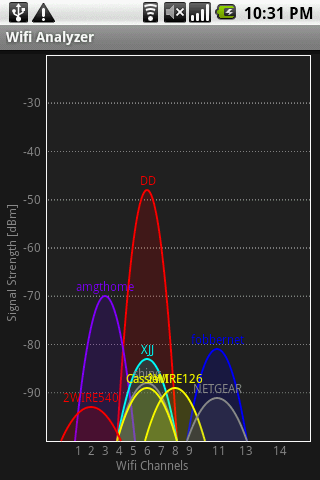
The Channel graph shows a graph view of all detected Wi-Fi access points and each router’s signal strength over time. You can also long press and select an AP to highlight for easier viewing.
The Time graph shows a color-coded run time graph of signal strength and how they have changed over time. It also includes APs filter that helps you display only the APs that you have chosen. You can also see a legend at the top of the screen that matches the AP names to their colors. By tapping on the AP name you can highlight the corresponding line graph. Channel rating shows all the recent channels and rates them on a scale of 0 to 10 stars. You can also compare one AP against the others, so you can choose the best suited channel for you.
AP list shows a list of all detected APs with information like current channel, frequency, signal strength, and security settings. This view also shows the AP you are currently connected to. You can sort the list alphabetically, according to signal strength, openness, and natural order.
Signal meter shows the signal strength of any selected AP. It displays a classic meter with a moving needle which moves according the signal strength. You can also enable sound to hear the rise and fall of signal. It can even capture the current state of the Channel graph, Channel rating, and AP list views using the snapshot feature and save it in a file. These snapshots are all saved in the WifiAnalyzer_Snapshot directory on the sd card.
Download Wifi Analyzer.